Image Details
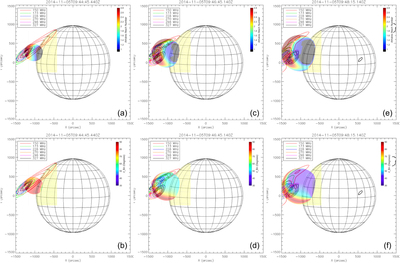
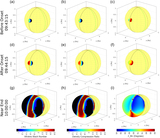
Caption: Figure 8.
Comparisons of the 3D distributions of the shock parameters with the sources of type II radio emission from NRH observations. Panels (a), (c), and (e) show the 3D distribution of MA at the shock surface, and panels (b), (d), and (f) show the 3D distribution for θBN. From left to right the panels show different time intervals considered for this comparison.
Other Images in This Article


Copyright and Terms & Conditions
© 2021. The Author(s). Published by the American Astronomical Society.
Copyright ©
2025 Astronomy Image Explorer. All Rights Reserved.