Image Details
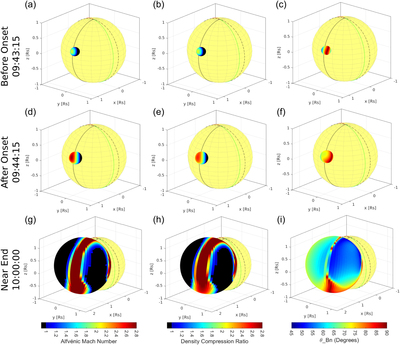
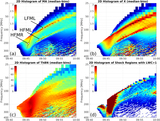
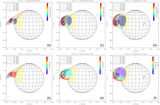
Caption: Figure 6.
Results of the modeled shock parameters in 3D, overplotted along the reconstructed pressure wave front surface for three selected time intervals. Top panels show the modeled shock parameters before type II onset, middle panels show after type II onset, and the bottom panels show near the apparent end of the type II radio burst. The distributions of the modeled MA, X, and θBN are shown in the left, middle, and right panels, respectively, for each time interval.
Other Images in This Article


Copyright and Terms & Conditions
© 2021. The Author(s). Published by the American Astronomical Society.
Copyright ©
2025 Astronomy Image Explorer. All Rights Reserved.