Image Details
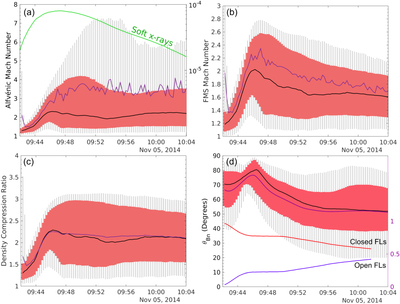
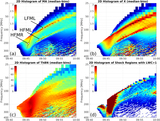
Caption: Figure 5.
Temporal evolution of the (a) MA, (b) Mfm, (c) compression ratio, and (d) θBN obtained in the shock wave modeling. The resultant time-varying distribution characteristics (mean, median, and first/third quartile and decile values) of the shock parameters are also plotted in each panel. The mean is depicted with the blue lines, the median with black lines, the first/third quartile with the red shaded area, and the decile values are shown with the vertical bars. In panel (a) we also show the time history of the soft X-ray flux (green line), and in panel (d) we show the fraction of closed or open field lines to the total number of field lines connected to the shock surface.
Other Images in This Article


Copyright and Terms & Conditions
© 2021. The Author(s). Published by the American Astronomical Society.