Image Details
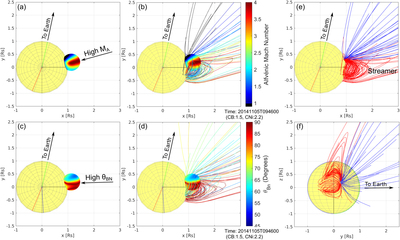
Caption: Figure 4.
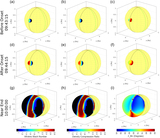
Results of the modeled shock wave parameters in 3D plotted along the reconstructed pressure wave front surface around 09:46:00 UT. Panels (a) and (b) show the distributions of the modeled MA and panels (c) and (d) the distributions of the modeled θBN along the front surface, with and without the field lines traced from the MAST model. For display purposes only a fraction of the total field lines that are connected to the wave surface are plotted in panels (b) and (d). The coloring of the field lines is analogous to the shock parameter value at the point where the field line threads the shock surface. Panels (e) and (f) show 3D views from different viewing directions of the traced field lines. Open and closed field lines are depicted in blue and red. The central solar meridian, as viewed from Earth and STEREO-A, is shown with green and red arcs, respectively. (An animation of panels (b) and (d), running from 09:44:30 to 09:49:30 UT, is available in the online Journal.)
(An animation of this figure is available.)
The video/animation of this figure is available in the online journal.
Other Images in This Article

Copyright and Terms & Conditions
© 2021. The Author(s). Published by the American Astronomical Society.