Image Details
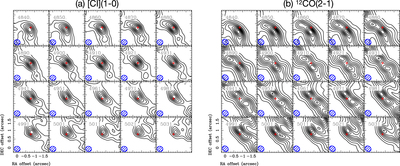
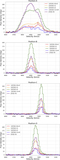
Caption: Figure 5.
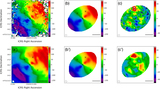
Velocity channel maps of (a) [C I](1–0) and (b) 12CO(2–1) line emission in the central 2″ × 2″ (1″ = 334 pc) region of NGC 7469. The red plus signs indicate the AGN position. The synthesized beam is plotted in the bottom left corner. Contours are drawn at 5σ, 10σ, 15σ, .., 45σ levels (1σ = 3.04 mJy beam−1) for panel (a) and 10σ, 25σ, 50σ, 75σ, ..., 300σ levels (1σ = 0.28 mJy beam−1) for panel (b). Note that the positional offsets are relative to the phase reference center, which is not identical to the AGN position. At VLSR ∼ 4920 km s−1, the peak position of the [C I](1–0) line distribution coincides with the exact AGN position.
Other Images in This Article
Show More
Copyright and Terms & Conditions
© 2020. The American Astronomical Society. All rights reserved.