Image Details
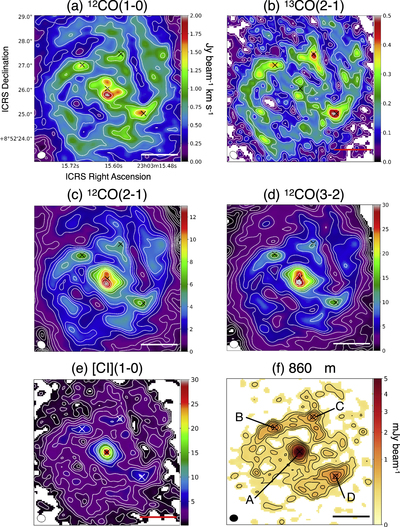
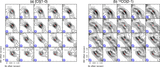
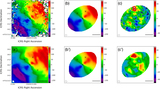
Caption: Figure 2.
Integrated intensity maps of (a) 12CO(1–0), (b) 13CO(2–1), (c) 12CO(2–1), (d) 12CO(3–2), and (e) [C I](1–0) in the central ∼2 kpc region of NGC 7469, shown in units of Jy beam−1 km s−1. The common velocity range that is integrated over is 4650–5200 km s−1 for all line emission maps. The 860 μm continuum emission map (mJy beam−1) is shown in panel (f) to define the four representative positions (A–D; shown by the crosses in each panel) where we measure line fluxes and spectra. Position A corresponds to the AGN position of this galaxy. In the emission line maps, contours are drawn at 3, 5, 7, 10, 15, 20, 30, 40, 50, 75, 100, 125, 150, 200, 250, 300, 350, ..., 600, and 650 × σ levels (1σ values are listed in Table 5). The ellipses in the bottom left corner indicate the synthesized beams, and the horizontal bar in each panel corresponds to 500 pc length. Note that the native resolution maps are shown here, whereas we convolve these maps to a common 0.″38 resolution to take line ratios. The signals below 1.5σ are masked to enhance the clarity.
Other Images in This Article
Show More
Copyright and Terms & Conditions
© 2020. The American Astronomical Society. All rights reserved.