Image Details
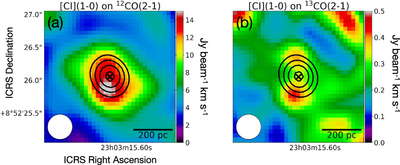
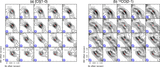
Caption: Figure 3.
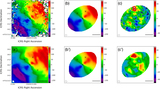
Close-up view of the CND. The color scales indicate (a) CO(2–1) and (b) 13CO(2–1) distributions. The 1σ rms values are (a) 0.025 and (b) 0.015 Jy beam−1 km s−1. Also, the plotted contours indicate the [C I](1–0) distribution (70σ, 80σ, 90σ, ..., 130σ, where 1σ = 0.245 Jy beam−1 km s−1). These emissions are mapped at a common 0.″38 resolution. The central cross in each panel defines the AGN location (position A).
Other Images in This Article
Show More
Copyright and Terms & Conditions
© 2020. The American Astronomical Society. All rights reserved.
Copyright ©
2025 Astronomy Image Explorer. All Rights Reserved.