Image Details
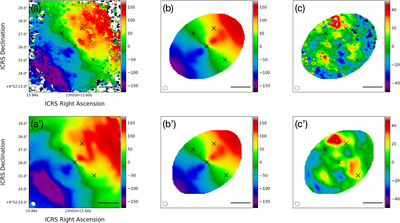
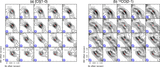
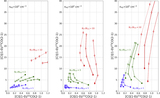
Caption: Figure 10.
(a) Observed intensity-weighted mean velocity field of the [C I](1–0) emission in the central 7″ (∼2.3 kpc) of NGC 7469. (b) Model velocity field of [C I](1–0) using the tilted-ring method. (c) Residual velocity image after subtracting the model from the observed map. Residuals are close to 0 km s−1 around the AGN. (a′)–(c′) Same as the top row but for the cases of CO(2–1) dynamics. In each panel, the four representative positions A–D (Table 6) are marked by crosses, and the horizontal bar corresponds to 500 pc length.
Other Images in This Article
Show More
Copyright and Terms & Conditions
© 2020. The American Astronomical Society. All rights reserved.
Copyright ©
2025 Astronomy Image Explorer. All Rights Reserved.