Image Details
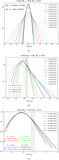
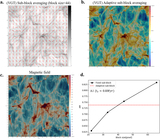
Caption: Figure 4.
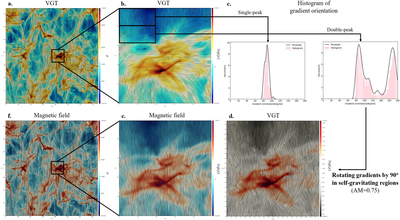
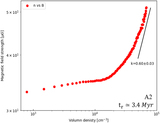
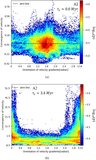
Example of how velocity gradients change orientations at the gravitational collapsing region, using simulation A1 with tr ≃ 0.8 Myr (see Table 1). Panels (a) and (b): a global and a zoom-in magnetic field morphology respectively inferred from VGT. Magnetic field is superimposed on the projected intensity map and visualized using the Line Integral Convolution (LIC). LIC is plotted using Paraview’s default setting with steps 40 and step size 0.25. Panels (f) and (e): a global and a zoom-in magnetic field morphology respectively inferred from synthetic polarization. Panel (c): histogram of velocity gradients' orientation in the diffuse region, which shows a single-peak Gaussian profile (left), and in the boundary of the gravitational collapsing region, which shows a double-peak Gaussian profile (right). This same region has been shown to be gravitationally collapsing in Figure 13 through the N-PDFs. Panel (d): zoom-in magnetic field morphology inferred from VGT with a 90° rerotation implemented for the gravitationally collapsing region; corresponding AM is 0.75.
Other Images in This Article
Show More
Copyright and Terms & Conditions
© 2020. The American Astronomical Society. All rights reserved.