Image Details
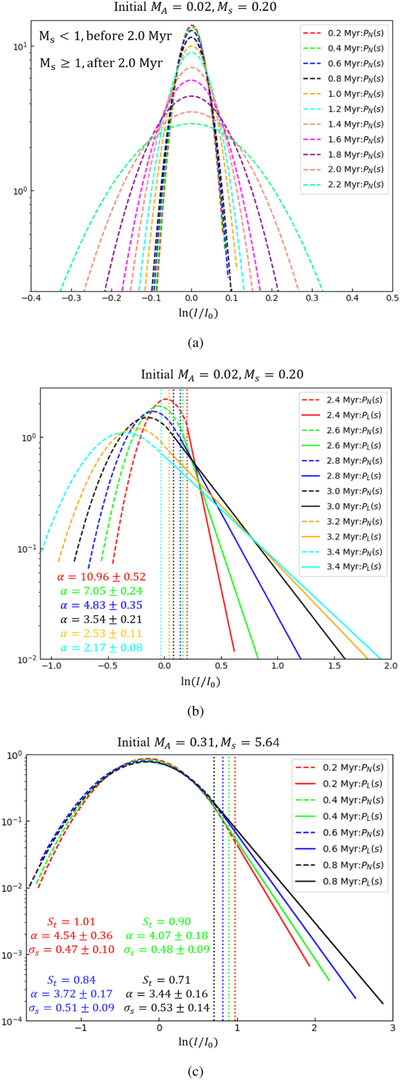
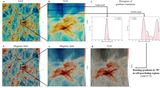
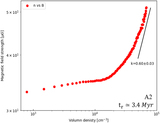
Caption: Figure 5.
Log-normal plus power-law models of normalized PDF with bin size 100. Dotted line outlines all the density past the transition density, which is the dense self-gravitating gas. Here, α is the slope of the power-law part, I0 is the mean intensity value, St denotes the transition density, and σs represents the standard deviation of the log-normal part.
Other Images in This Article
Show More
Copyright and Terms & Conditions
© 2020. The American Astronomical Society. All rights reserved.
Copyright ©
2025 Astronomy Image Explorer. All Rights Reserved.