Image Details
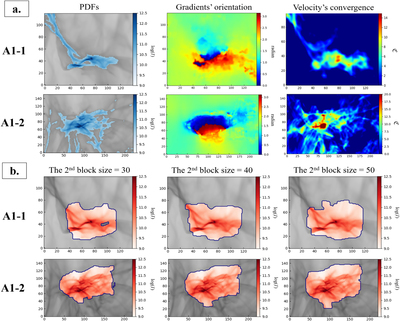
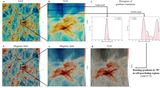
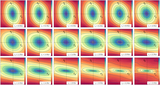
Caption: Figure 13.
Panel (a): the first and second rows are two subregions extracted from simulation A1 at tr ≃ 0.8 Myr, denoted as A1-1 (length scale ≃1.7 pc) and A1-2 (length scale ≃2.8 pc), respectively. First column: gravitationally collapsing regions (blue regions) identified from the N-PDFs. Second column: orientation of velocity gradients in the range of [0, π] (i.e., red: ≃π, blue: ≃0, and green: ≃π/2). Third column: projected velocity convergence of each corresponding region. Discontinuity comes from numerical effect. Panel (b): gravitationally collapsing regions (red regions) identified from the double-peak feature of velocity gradients' morphology. Second block size is implemented in the double-peak algorithm to plot the histogram of velocity gradients’ orientation in a subregion. We test three block sizes: 30, 40, and 50 pixels.
Other Images in This Article
Show More
Copyright and Terms & Conditions
© 2020. The American Astronomical Society. All rights reserved.