Image Details
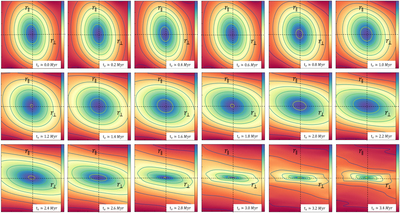
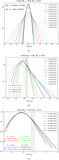
Caption: Figure 8.
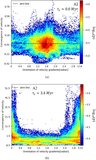
Correlation function of 2D intensity maps at different snapshots, using simulation set A2. Here, r⊥ and r∥ are the real space scales perpendicular and parallel to the magnetic field respectively. For all plots, r⊥ and r∥ are in scales less than 60 pixels.
Other Images in This Article
Show More
Copyright and Terms & Conditions
© 2020. The American Astronomical Society. All rights reserved.
Copyright ©
2025 Astronomy Image Explorer. All Rights Reserved.