Image Details
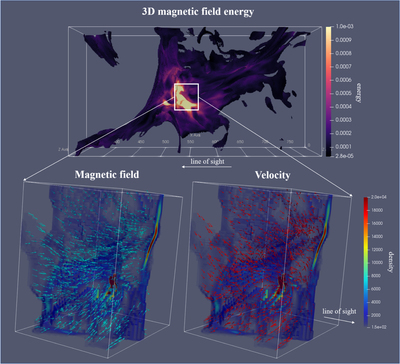
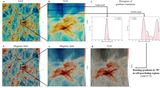
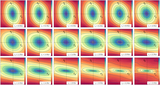
Caption: Figure 22.
Top: visualization of 3D magnetic field energy using simulation A1 at tr ≃ 0.8 Myr. We highlight high-intensity structures, i.e., their corresponding intensity is five times larger than the global mean value. Bottom: visualization of magnetic field’s orientation (left, blue vectors) and velocity’s direction (right, red vectors). Note that this subregion exhibits high magnetic field energy and the velocity indicates the direction of convergent flow. Units of energy and volume density are M⊙ pc2 Myr−2 and M⊙ pc−3, respectively.
Other Images in This Article
Show More
Copyright and Terms & Conditions
© 2020. The American Astronomical Society. All rights reserved.
Copyright ©
2025 Astronomy Image Explorer. All Rights Reserved.