Image Details
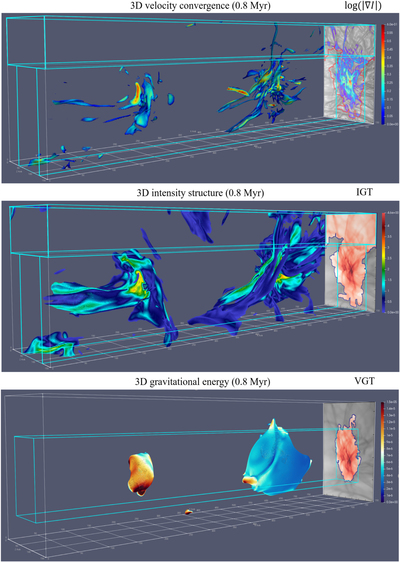
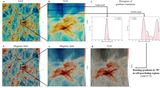
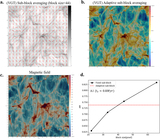
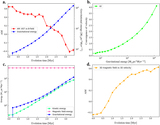
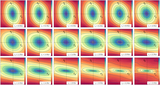
Caption: Figure 21.
Top: visualization of 3D velocity convergence using simulation A1 at tr ≃ 0.8 Myr. Positive convergence outlines the convergent inflow. Inner blue box approximately outlines the boundary of the 3D collapsing region identified from IGT. Projected 2D plot on the right side shows the corresponding intensity gradients amplitude log ﹩(| {\rm{\nabla }}I| )﹩. We mask the low-amplitude pixel, i.e., its corresponding amplitude is less than the global mean value. Middle: visualization of 3D intensity structures. Inner blue box approximately outlines the boundary of the 3D collapsing region identified from IGT (red region in the 2D projection). We highlight high-intensity structures, i.e., their corresponding intensity is five times larger than the global mean value. Bottom: visualization of 3D gravitational energy. Inner blue box approximately outlines the boundary of the 3D collapsing region identified from VGT (red region in the 2D projection). We keep only the pixels with high gravitational energy, i.e., those with corresponding gravitational energy five times larger than the global mean value.
Other Images in This Article
Show More
Copyright and Terms & Conditions
© 2020. The American Astronomical Society. All rights reserved.