Image Details
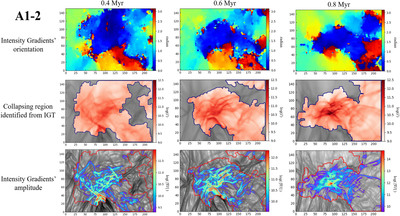
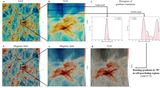
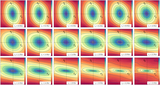
Caption: Figure 20.
Example showing how to identify collapsing regions from the curvature of intensity gradients. We use three different collapsing stages of subregion A1-2, i.e., 0.4 Myr (first column), 0.6 Myr (second column), and 0.8 Myr (third column). First row: orientation of intensity gradients in the range of [0, π) (i.e., red: ≃π, blue: ≃0, and green: ≃π/2). Second row: gravitationally collapsing regions (red regions) identified from the curvature of intensity gradients. Third row: areas of the gradients' amplitude corresponding to the collapsing regions identified by intensity gradients. In the same regions, we mask the low-amplitude pixel, i.e., its corresponding amplitude is less than the global mean value.
Other Images in This Article
Show More
Copyright and Terms & Conditions
© 2020. The American Astronomical Society. All rights reserved.