Image Details
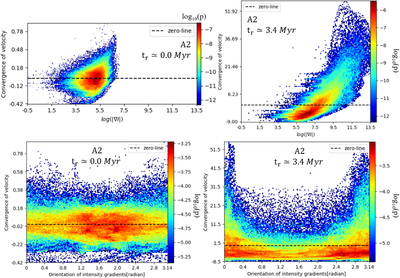
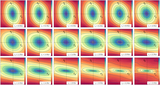
Caption: Figure 19.
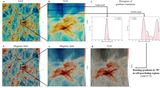
Top row: 2D histogram of intensity gradients’ amplitude, i.e., ﹩\mathrm{log}(| {\rm{\nabla }}I| )﹩, and velocity’s convergence using A2 simulation at tr ≃ 0.0 Myr (left) and tr ≃ 3.4 Myr (right). Here, p gives the volume fraction of each data point. Bottom row: 2D histogram of intensity gradients’ orientation and velocity’s convergence using A2 simulation. Note that the orientation is measured in typical Cartesian coordinates, i.e., with respect to the right horizontal direction. Bin size is 200 for the 2D histograms.
Other Images in This Article
Show More
Copyright and Terms & Conditions
© 2020. The American Astronomical Society. All rights reserved.
Copyright ©
2025 Astronomy Image Explorer. All Rights Reserved.