Image Details
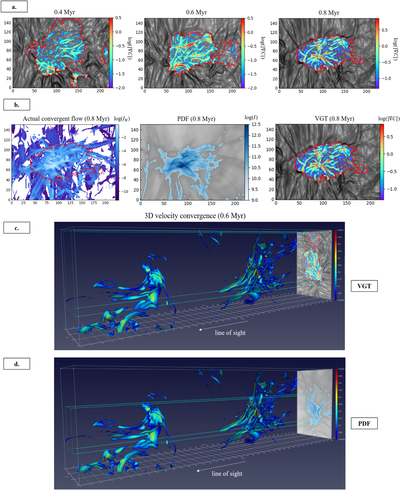
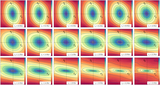
Caption: Figure 17.
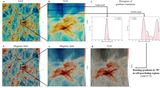
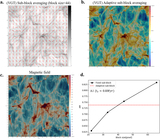
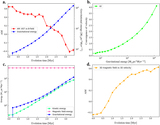
Panel (a): areas of the gradients' amplitude corresponding to the collapsing regions identified by VGT (see Figure 15) in A1-2 at tr ≃ 0.4 Myr (left), 0.6 Myr (middle), and 0.8 Myr (right). In the same regions, we mask the low-amplitude pixel, i.e., its corresponding amplitude is less than the global mean value. Remaining colorful areas indicate high-amplitude gradients and a high convergence, i.e., the convergent inflow. Panel (b): comparison of the convergent flow determined by the PDF (middle), VGT (right), and the actual convergent flow (left) at tr ≃ 0.8 Myr. Here, IN is the projection of normalized volume density. Panel (c): visualization of 3D velocity convergence. Positive convergence outlines the convergent inflow. Inner blue box approximately outlines the boundary of the collapsing region identified from VGT. Panel (d): visualization of 3D velocity convergence. Inner blue box approximately outlines the boundary of the collapsing region identified from N-PDFs.
Other Images in This Article
Show More
Copyright and Terms & Conditions
© 2020. The American Astronomical Society. All rights reserved.