Image Details
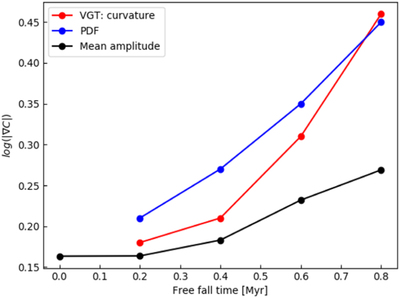
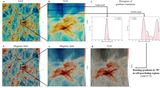
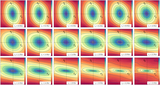
Caption: Figure 16.
Comparison of the average velocity gradients’ amplitude in the self-gravitating regions identified from N-PDFs (blue) and VGT’s curvature algorithm (red). Corresponding regions are shown in Figure 15. Black line indicates the global mean convergence in each region.
Other Images in This Article
Show More
Copyright and Terms & Conditions
© 2020. The American Astronomical Society. All rights reserved.
Copyright ©
2025 Astronomy Image Explorer. All Rights Reserved.