Image Details
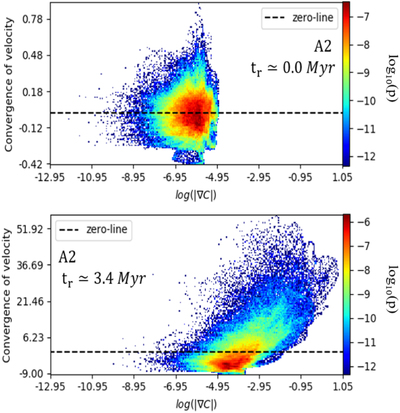
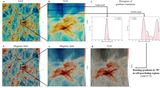
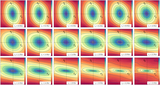
Caption: Figure 11.
Two-dimensional histogram of velocity gradients’ amplitude, i.e., ﹩\mathrm{log}(| {\rm{\nabla }}C| )﹩, and velocity’s convergence using simulation A2 at tr ≃ 0.0 Myr (top) and tr ≃ 3.4 Myr (bottom). Here, p gives the volume fraction of each data point. Bin size is 200 for the 2D histograms.
Other Images in This Article
Show More
Copyright and Terms & Conditions
© 2020. The American Astronomical Society. All rights reserved.
Copyright ©
2025 Astronomy Image Explorer. All Rights Reserved.