Image Details
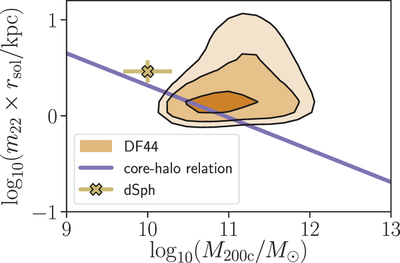
Caption: Figure 8.
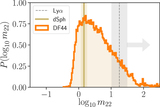
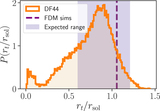
Posterior distribution of ﹩{M}_{200{\rm{c}}}﹩ and ﹩{m}_{22}\times {r}_{\mathrm{sol}}﹩ for Dragonfly 44 compared to the expected scaling relation. The violet line shows the functional relationship between halo mass and core size predicted by Schive et al. (2014a). The yellow × shows the inferred core size from dSph galaxies (Chen et al. 2017). There is a broad range of allowed core sizes, but the mode of the distribution is consistent with the expected scaling relation.
Other Images in This Article
Copyright and Terms & Conditions
© 2019. The American Astronomical Society. All rights reserved.
Copyright ©
2025 Astronomy Image Explorer. All Rights Reserved.