Image Details
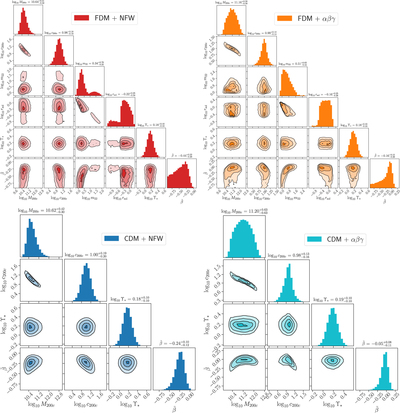
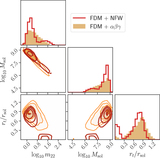
Caption: Figure 11.
Marginalized posterior distributions for the four halo models. The top panels show the FDM models from this work. The bottom panels show the CDM models from Paper I. Left panels are for NFW halo profiles, and right panels show the results for the ﹩\alpha \beta \gamma ﹩ halo profiles. Within both top (FDM) panels the parameters are (from left to right, or top to bottom) the log of the halo mass, the log of the halo concentration, the log scalar field mass, the log soliton scale radius, the log of the stellar mass-to-light ratio, and the symmetric parameterization of the anisotropy parameter. Contours show isodensity surfaces from 0.5 to 2.0 “sigma” levels (for a 2D Gaussian).
Other Images in This Article
Copyright and Terms & Conditions
© 2019. The American Astronomical Society. All rights reserved.