Image Details
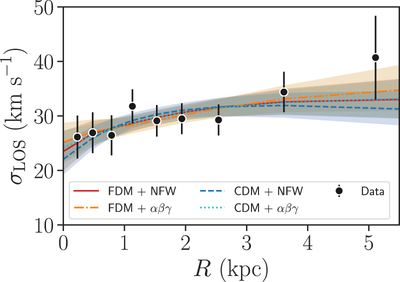
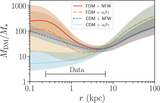
Caption: Figure 2.
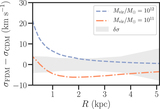
Posterior predictive checks on the velocity dispersion profiles for the FDM halo models compared with the kinematic observations, with the CDM halo models from Paper I shown for comparison. The red solid and orange dotted–dashed lines show the FDM halo models for the NFW and ﹩\alpha \beta \gamma ﹩ outer profiles. The dark blue dashed and cyan dotted lines show the CDM halo models for the NFW and ﹩\alpha \beta \gamma ﹩ profiles. The shaded regions cover the 16th through 84th percentiles of the distribution. We see that all four models do an adequate job of recovering the general trend of the kinematic data.
Other Images in This Article
Copyright and Terms & Conditions
© 2019. The American Astronomical Society. All rights reserved.
Copyright ©
2025 Astronomy Image Explorer. All Rights Reserved.