Image Details
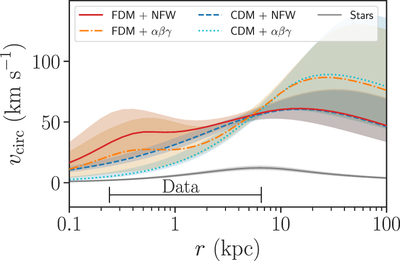
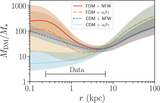
Caption: Figure 3.
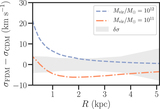
Circular velocity corresponding to the dynamical mass (DM + stars) for the FDM halo models, compared with their CDM halo counterparts. Note that these are profiles in de-projected (3D) radius, in contrast to the projected (2D) radial profiles shown in Figure 2. The bottom gray solid line shows the circular velocity profile corresponding to just the stellar mass for the NFW model. The black bar at the bottom indicates the spatial extent of the kinematic data. The dynamical mass within 5 kpc (∼Re) is well constrained by the data, but the mass within 1 kpc is degenerate with the chosen model.
Other Images in This Article
Copyright and Terms & Conditions
© 2019. The American Astronomical Society. All rights reserved.
Copyright ©
2025 Astronomy Image Explorer. All Rights Reserved.