Image Details
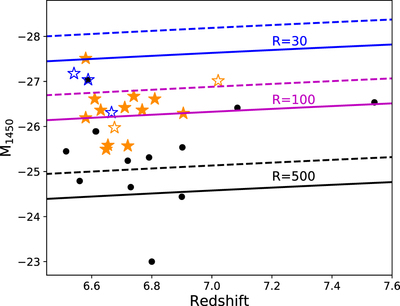
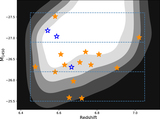
Caption: Figure 4.
Redshift and absolute magnitude distribution and radio-loudness constraints of z > 6.5 quasars. The symbols are the same as in Figure 3. The solid lines denote radio-loudness calculated from the FIRST flux limit, and dashed lines denote radio-loudness calculated from the NVSS flux limit. The black, magenta, and blue curves represent R = 500, R = 100, and R = 30, respectively. It shows that both FIRST and NVSS surveys are too shallow to rule out that those z > 6.5 quasars are radio-loud quasars with R ∼ 100. But none of our newly discovered quasars are extremely radio-loud quasars with R > 500.
Other Images in This Article
Show More
Copyright and Terms & Conditions
© 2019. The American Astronomical Society. All rights reserved.
Copyright ©
2026 Astronomy Image Explorer. All Rights Reserved.