Image Details
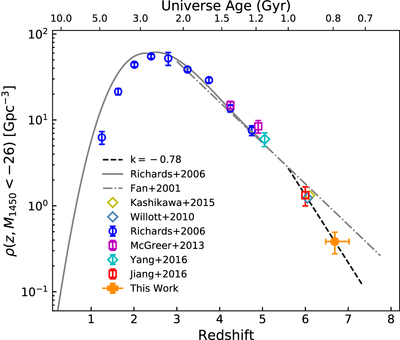
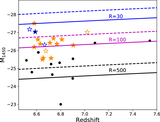
Caption: Figure 10.
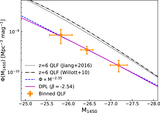
Density evolution of luminous quasars. The gray solid line and dashed line denote the evolution model from Richards et al. (2006) and Fan et al. (2001), respectively. The black dashed line denotes the density evolution model from z ∼ 6 to z ∼ 6.7 with k = −0.78. The gray solid line and gray dotted–dashed lines are from Richards et al. (2006) and Fan et al. (2001), respectively. The orange filled circle denotes our measurement at the highest redshift. The blue open circles are density measured from the binned SDSS quasar luminosity function (Richards et al. 2006). The magenta and red open squares are densities measured using the binned luminosity function from McGreer et al. (2013) and Jiang et al. (2016), respectively. The cyan, steel-blue, and yellow open diamonds denote densities integrated from the QLF measured by Yang et al. (2016), Willott et al. (2010), and Kashikawa et al. (2015), respectively.
Other Images in This Article
Show More
Copyright and Terms & Conditions
© 2019. The American Astronomical Society. All rights reserved.