Image Details
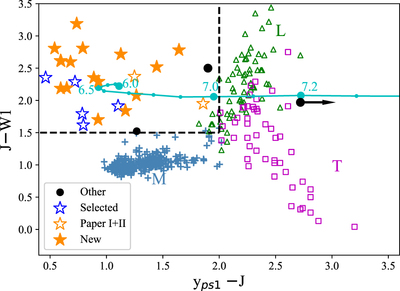
Caption: Figure 1.
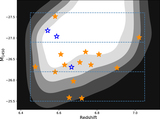
The yps1,AB − JVEGA vs. JVEGA − W1VEGA color–color diagram. The cyan line and cyan filled circles represent the color–redshift relation predicted using simulated quasars (McGreer et al. 2013; Yang et al. 2016) from z = 6.0 to z = 7.3, in steps of Δz = 0.1. The large cyan circles highlight the colors at z = 6.0, 6.5, 7.0, and 7.2. The orange open stars denote two z > 6.5 quasars reported in Papers I and II and , and orange filled stars denote z ≳ 6.4 quasars found in this paper. The open blue stars depict previously known z > 6.5 quasars that were recovered by our selections. The small black circle denotes a previously known z > 6.5 quasar that had all PS1, NIR, and WISE detections. The two larger black circles present two known z > 7 quasars (Mortlock et al. 2011; Bañados et al. 2018) with yps1 from forced photometry on PS1 images. The steel blue crosses, green open triangle, and magenta open squares depict the positions of M, L, and T dwarfs, respectively (Kirkpatrick et al. 2011; Best et al. 2015).
Other Images in This Article
Show More
Copyright and Terms & Conditions
© 2019. The American Astronomical Society. All rights reserved.