Image Details

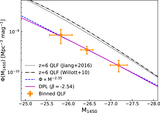
Caption: Figure 13.
Evolution of the comoving production rate of ionizing photons. The filled and open circles are production rates of ionizing photons at z ∼ 6.7 based on our single power-law QLF and double power-law QLF, respectively. Note that the open circle was shifted by 0.05 on the x-axis for clarity. The magenta open squares are the quasar ionizing photon production rates at lower redshift calculated based on our recalculations of quasar comoving emissivity from Khaire & Srianand (2015). The blue filled diamonds and triangles denote the required photon production rate inferred from measurements of the mean transmitted Lyα flux by Becker & Bolton (2013) and D’Aloisio et al. (2018), respectively. The blue solid line represents the required rate inferred from measurements of the mean transmitted Lyα flux from Meiksin (2005). The dashed–dotted and dashed lines are the required photon rate density to balance hydrogen recombination by assuming C = 2 and C = 3 (Madau et al. 1999), respectively.
Other Images in This Article
Show More
Copyright and Terms & Conditions
© 2019. The American Astronomical Society. All rights reserved.