Image Details
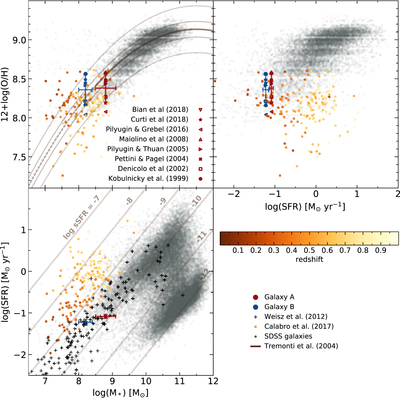
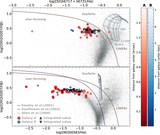
Caption: Figure 8.
The relationship between the stellar mass, metallicity, and SFR for the dwarf galaxy pair, superimposed upon the results for star-forming dwarf galaxies from Calabrò et al. (2017) (dots, color-coded according to their redshift), galaxies from the MPA-JHU SDSS DR7 (black dots, Brinchmann et al. 2004; Tremonti et al. 2004), and the mass–SFR relation of Weisz et al. (2012) (crosses) for local star-forming dwarf galaxies. The mass–metallicity relation of Tremonti et al. (2004) for star-forming SDSS galaxies in the mass range ﹩8.5\lt {\mathrm{log}}_{10}({{ \mathcal M }}_{* })\lt 10.5﹩ and z ≲ 0.1 has been overplotted for reference (dark shaded curve), with the dashed curve at ﹩{\mathrm{log}}_{10}({{ \mathcal M }}_{* })\lt 8.5﹩ showing the extrapolation to lower masses, and the light-shaded curves representing the 1 and 3σ offsets. The lines of constant sSFR have also been plotted for reference on the mass–SFR plot. The hollow symbols represent the different metallicity measurements when using calibration coefficients from the literature for various line ratios, and the error bars indicate the mean and standard deviation of these measurements (see Section 3.8).
Other Images in This Article

Copyright and Terms & Conditions
© 2019. The American Astronomical Society. All rights reserved.