Image Details
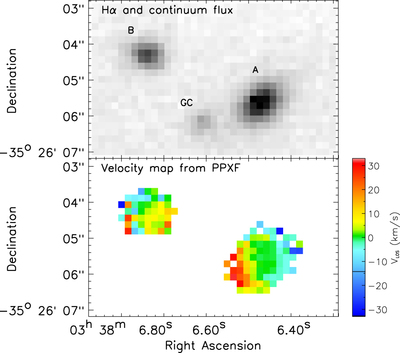
Caption: Figure 6.
A white-light image of the dwarf pair from the MUSE datacube covering the Hα emission line and the continuum (top), with the gas velocity map created by fitting all the emission lines in the spectrum with pPXF (bottom).
Other Images in This Article

Copyright and Terms & Conditions
© 2019. The American Astronomical Society. All rights reserved.
Copyright ©
2025 Astronomy Image Explorer. All Rights Reserved.