Image Details
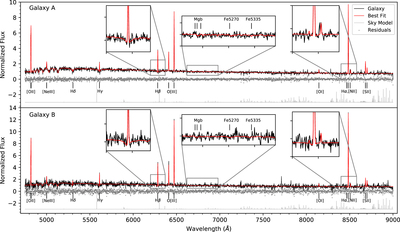
Caption: Figure 2.
The pPXF fits to the spectra for Galaxy ﹩{ \mathcal A }﹩ (top) and ﹩{ \mathcal B }﹩ (bottom), showing the input spectrum in black, the best-fitting model spectrum from the combined fits to the stars and gas in red, and the residuals as gray points. The gray line shows an example sky spectrum for reference, and the insets show a zoom-in on certain emission and absorption features.
Other Images in This Article

Copyright and Terms & Conditions
© 2019. The American Astronomical Society. All rights reserved.
Copyright ©
2025 Astronomy Image Explorer. All Rights Reserved.