Image Details
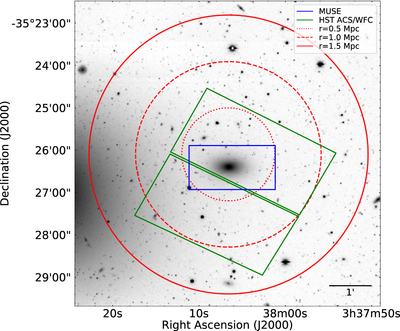
Caption: Figure 5.
The NGFS ﹩{i}^{{\prime} }﹩-band image centered on the dwarf–dwarf galaxy pair. The blue and green rectangles represent the fields of view of the MUSE and HST ACS/WFC data used in this study, respectively, while the dotted, dashed, and solid red lines reflect distances of 0.5, 1.0, and 1.5 Mpc on sky at z = 0.3.
Other Images in This Article

Copyright and Terms & Conditions
© 2019. The American Astronomical Society. All rights reserved.
Copyright ©
2025 Astronomy Image Explorer. All Rights Reserved.