Image Details
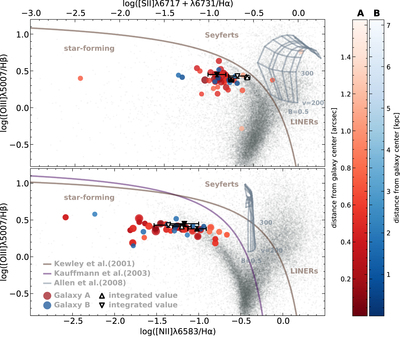
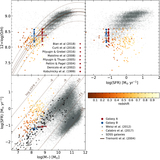
Caption: Figure 7.
The BPT diagrams for each spaxel covered by Galaxy ﹩{ \mathcal A }﹩ (red) and ﹩{ \mathcal B }﹩ (blue), where the size of the point represents the S/N of that measurement and the shading reflects the distance from the center of the galaxy. The gray points represent the measurements from the MPA-JHU SDSS DR7 galaxies for comparison, and the upward and downward pointing triangles with error bars represent the measurements from the integrated spectra for Galaxy ﹩{ \mathcal A }﹩ and ﹩{ \mathcal B }﹩ (filled) and the best fit to the gas emission lines from that spectrum (hollow), respectively. The shock-ionization model grids of Allen et al. (2008) are overlaid for reference, showing the predicted line ratios for shocks with velocities of 200–1000 km s−1 (horizontal lines), magnetic fields of strengths 0.5, 1, 2, 4, 5, and 10 μG (vertical lines), and for solar abundances from Dopita et al. (2005).
Other Images in This Article

Copyright and Terms & Conditions
© 2019. The American Astronomical Society. All rights reserved.