Image Details
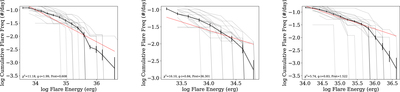
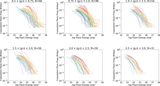
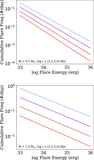
Caption: Figure 9.
Flare frequency distributions as shown from Figure 1 (black line), but with the final flare activity model from Equation (3) evaluated for each star’s mass and age (red line). Note that this model was not fit for each star’s FFD individually, but instead was fit to our entire sample of 347 stars.
Other Images in This Article
Copyright and Terms & Conditions
© 2019. The American Astronomical Society.
Copyright ©
2025 Astronomy Image Explorer. All Rights Reserved.