Image Details
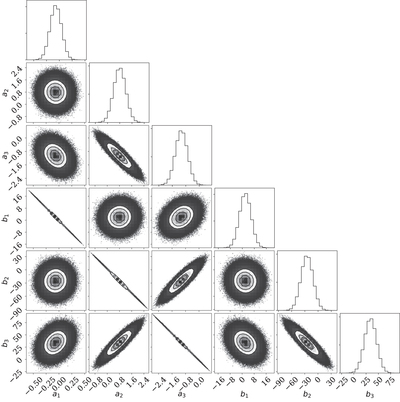
Caption: Figure 8.
The standard emcee sampler result corner plot, showing the one- and two-dimensional posterior distributions for each free parameter in Equation (3). The density of the points and contours correlate with the posterior probability distribution from a 100,000 step run of the emcee sampler. Degeneracies are apparent between several parameters, seen here as very narrow distributions in three panels (a1, b1), (a2, b2), and (a3, b3), indicating our chosen model in Equation (3) may have unnecessary complexity.
Other Images in This Article
Copyright and Terms & Conditions
© 2019. The American Astronomical Society.
Copyright ©
2025 Astronomy Image Explorer. All Rights Reserved.