Image Details
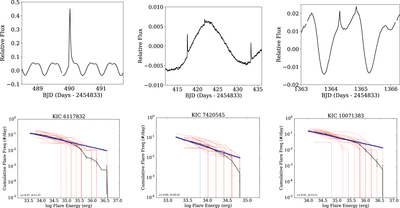
Caption: Figure 1.
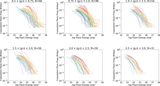
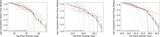
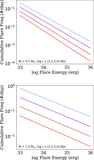
Three examples of flare stars from the Davenport (2016a) sample. Top row: sample light curves. Bottom row: cumulative flare frequency distributions (FFDs) from the appaloosa flare-finding analysis of Davenport (2016a) for the same three stars. The FFD from each short cadence (blue lines) and long cadence (red lines) data set is included, as well as the mean FFD (black) with Poisson uncertainties shown. Each star’s mean FFD is fit with a power law (heavy navy line), whose slope and intercept in log–log space (α and β) are noted.
Other Images in This Article
Copyright and Terms & Conditions
© 2019. The American Astronomical Society.
Copyright ©
2025 Astronomy Image Explorer. All Rights Reserved.