Image Details
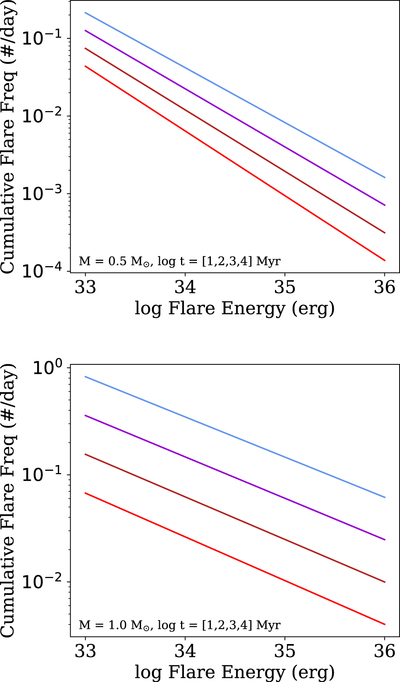
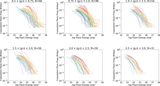
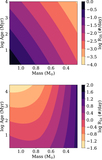
Caption: Figure 10.
Our best-fit flare evolution model showing the predicted FFD evaluated at four age bins for a 0.5 M⊙ (top) and 1.0 M⊙ star (bottom). Although the change in FFD slopes as a function of age is negligible, the difference as a function of mass is significant. Note: these FFDs are drawn at the same energy ranges for ease of comparison, but do not correspond to the specific flare energies detected at these masses.
Other Images in This Article
Copyright and Terms & Conditions
© 2019. The American Astronomical Society.
Copyright ©
2025 Astronomy Image Explorer. All Rights Reserved.