

Image Details
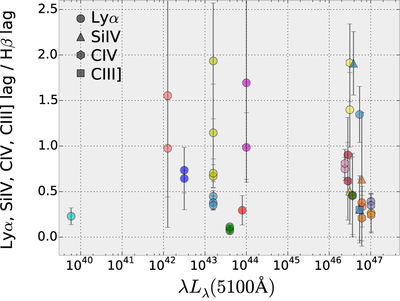
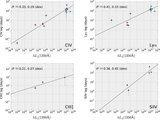
Caption: Figure 8.
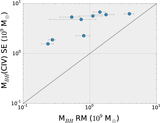
Ratio of Lyα, Si IV, C IV, and C III] to Hβ lags. The Lyα, Si IV, C IV, and C III] lags are those presented in Table 4, while the Hβ lags were predicted using the ﹩\lambda {L}_{\lambda }(5100\,\mathring{\rm A} )﹩ vs. Hβ radius–luminosity correlation found in Bentz et al. (2013) and the inferred 5100 Å luminosities (see text). Different shapes correspond to different emission lines (see legend), while different colors correspond to different sources. Seyfert galaxies are NGC 3783, NGC 4151, NGC 5548, NGC 7469, and 3C 390.3, as stated before. We have also added data from the 1989 campaign of NGC 5548 and published by Clavel et al. (1991), as it includes the C III] emission line (after recalculating the lags using the ICCF FR/RSS code that we employed with our sources). The objects reported in this work are clustered at the high-luminosity end of the diagram. Errors in the Lyα, Si IV, C IV, and C III] lines were assumed as the average of the lower and upper 1σ confidence limits in the lag measurements, while the scatter in the Hβ radius–luminosity correlation for the Clean2 sample from Bentz et al. (2013) was taken as the Hβ lag errors.
Other Images in This Article
Copyright and Terms & Conditions
© 2018. The American Astronomical Society. All rights reserved.

