

Image Details
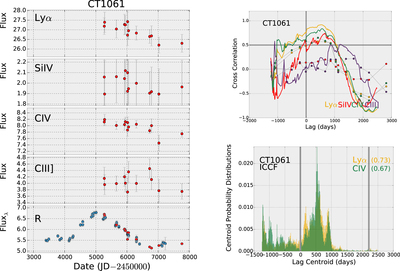
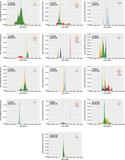
Caption: Figure 5. Quasar Light-Curves
The complete figure set (17 images) is available in the online journal.
Left: line and continuum light curves for all quasars with spectroscopic follow-up. Red circles correspond to measurements taken from the spectroscopic data, while blue circles correspond to broadband R photometry. Units are 10−14 erg s−1 cm−2 for the line measurements and 10−16 erg s−1 cm−2 Å−1 for the R-band light curves. Top right panels: correlation functions obtained using the ICCF (solid line) and ZDCF (circles) methods for the Lyα, Si IV, C IV, and C III] emission lines. Bottom right panels: CCCDs obtained from the ICCF FR/RSS analysis for those lines with significant peaks in their ZDCF and ICCF correlation functions. Thick gray lines show the limits of the distributions used for lag error determinations. The fraction of the CCCD contained within the thresholds is shown in parentheses for each line. For further details, see the text.
Other Images in This Article
Copyright and Terms & Conditions
© 2018. The American Astronomical Society. All rights reserved.

