

Image Details
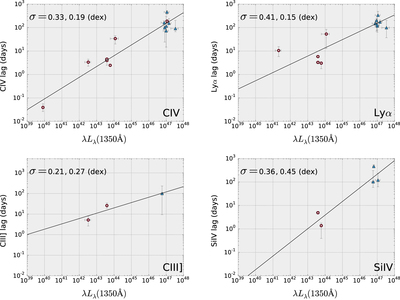
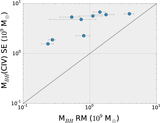
Caption: Figure 7.
Radius–luminosity relations for the Lyα, C IV, C III], and Si IV emission lines. Our sources are presented with blue filled triangles, while sources taken from the literature are presented with red circles. The solid black lines show the linear regression to the data using a bivariate analysis. Two values of σ are shown at the top left of each panel, where the first value corresponds to the observed scatter and the second value corresponds to the scatter due to measurement errors.
Other Images in This Article
Copyright and Terms & Conditions
© 2018. The American Astronomical Society. All rights reserved.

Copyright ©
2026 Astronomy Image Explorer. All Rights Reserved.
