

Image Details
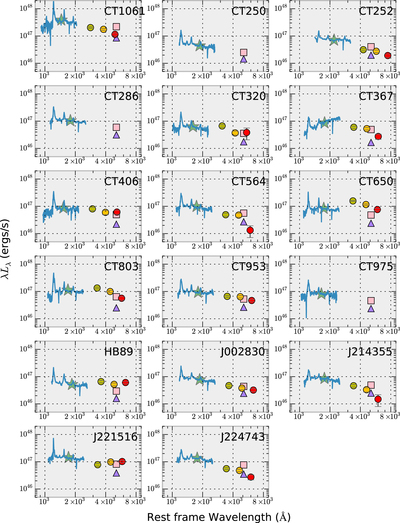
Caption: Figure 2.
Rest-frame spectral energy distributions of the quasars in our sample. Mean spectra for each source are shown together with our R-band (stars) and JHK 2MASS (circles) photometry. Two extrapolations to 5100 Å are also included: from 1350 Å (triangles) using the correlation determined in Mejía-Restrepo et al. (2016), and from the R-band photometry (squares) using the UV power-law index determined by Vanden Berk et al. (2001).
Other Images in This Article
Copyright and Terms & Conditions
© 2018. The American Astronomical Society. All rights reserved.

Copyright ©
2026 Astronomy Image Explorer. All Rights Reserved.
