

Image Details
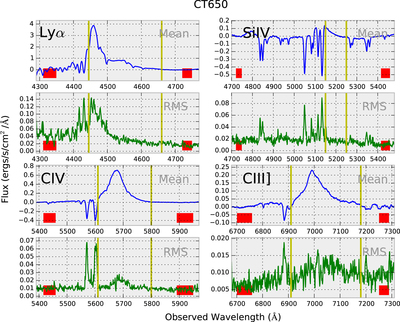
Caption: Figure 3.
Mean (top panels—in blue) and rms (bottom panels—in green) spectra of CT650 around the Lyα, Si IV, C IV, and C III] emission lines. The mean spectra have been continuum-subtracted using the continuum measurements obtained at the positions marked by red boxes. The line measurement is obtained as the summation of all flux between the vertical yellow lines.
Other Images in This Article
Copyright and Terms & Conditions
© 2018. The American Astronomical Society. All rights reserved.

Copyright ©
2026 Astronomy Image Explorer. All Rights Reserved.
