Image Details
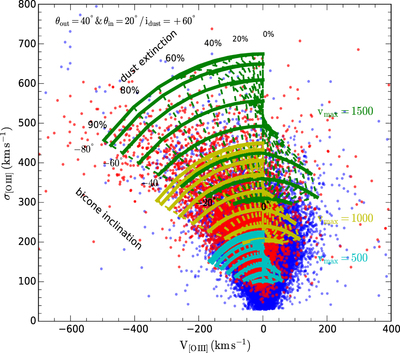
Caption: Figure 9.
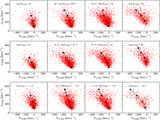
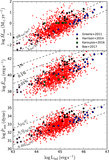
Model grids (lines) of the biconical outflow model developed by Bae & Woo (2016) overplotted on the VVD diagram for Type 1 (red dots) and Type 2 (blue dots) AGNs. See the text for explanation.
Other Images in This Article

Copyright and Terms & Conditions
© 2018. The American Astronomical Society. All rights reserved.
Copyright ©
2025 Astronomy Image Explorer. All Rights Reserved.