Image Details
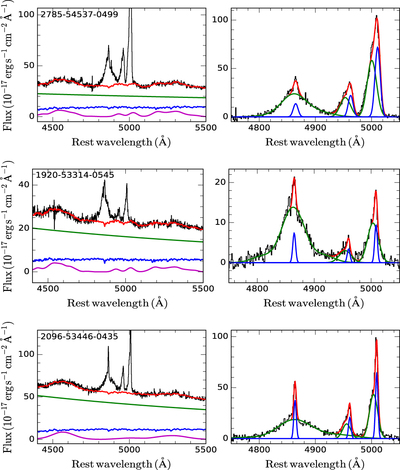
Caption: Figure 1.
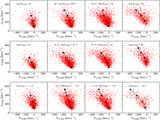
Examples of spectral fitting. Left: continuum modeling. The best-fit model (red), AGN continuum (green), host galaxy contribution (blue), and Fe II emission (magenta) are compared with the observed spectrum (black). Right: emission-line modeling. The continuum-subtracted spectrum (black) is compared with the best-fit model (red), which is composed of the broad (green) and narrow Hβ (blue) core (blue) and wing (green) components of [O III] doublets. The SDSS ID (plate-MJD-fiber) of each object is labeled in the left panels.
Other Images in This Article

Copyright and Terms & Conditions
© 2018. The American Astronomical Society. All rights reserved.
Copyright ©
2025 Astronomy Image Explorer. All Rights Reserved.