Image Details
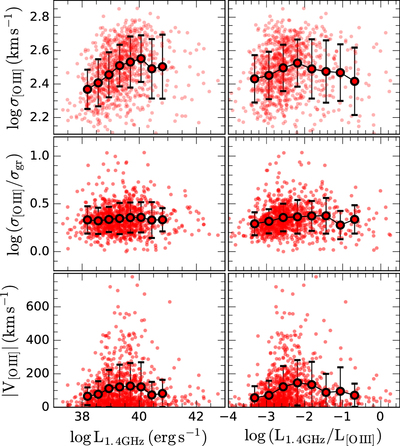
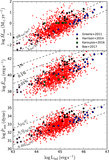
Caption: Figure 10.
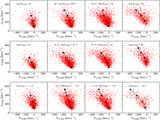
The [O III] velocity dispersion (top), dispersion ratio (middle), and velocity shift (bottom) as a function of luminosity at 1.4 GHz (left panels) and the luminosity ratio of 1.4 GHz to [O III] (right panels) for Type 1 AGNs. The mean values at each bin along the x-axis are shown along with the 1σ dispersion. In the plot, σgr = σ[O III],narrow is considered.
Other Images in This Article

Copyright and Terms & Conditions
© 2018. The American Astronomical Society. All rights reserved.
Copyright ©
2025 Astronomy Image Explorer. All Rights Reserved.