Image Details
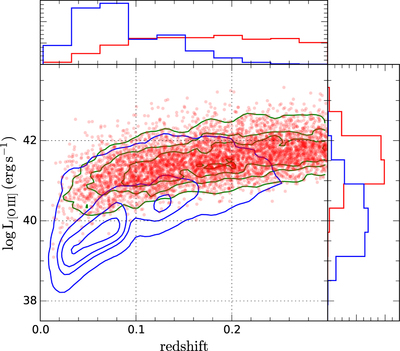
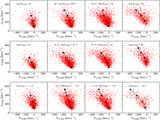
Caption: Figure 3.
Distribution of [O III] luminosity (L[O III]) and redshift of the Type 1 AGN sample (red). The 25th, 50th, 75th, and 99th percentile density contours are shown for Type 1 (green) and Type 2 AGNs (blue). The normalized histograms of redshift (top) and L[O III] (right) are also shown for Type 1 (red) and Type 2 (blue).
Other Images in This Article

Copyright and Terms & Conditions
© 2018. The American Astronomical Society. All rights reserved.
Copyright ©
2025 Astronomy Image Explorer. All Rights Reserved.