Image Details
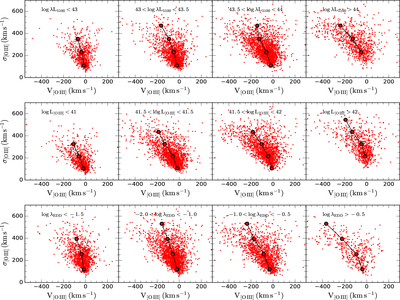
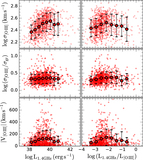
Caption: Figure 8.
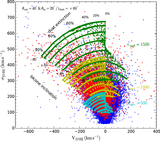
The VVD diagram of Type 1 AGNs for different λL5100 (top), L[O III] (middle), and Eddington ratio (bottom) estimated based on λL5100 (see the text for more explanation) bins. The mean velocity shift in each σ[O III] bin is shown by red circles.
Other Images in This Article

Copyright and Terms & Conditions
© 2018. The American Astronomical Society. All rights reserved.
Copyright ©
2025 Astronomy Image Explorer. All Rights Reserved.