Image Details
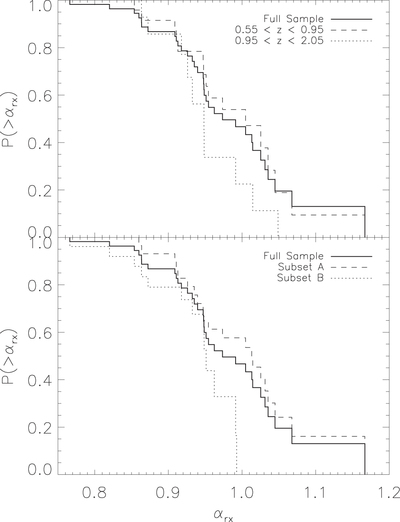
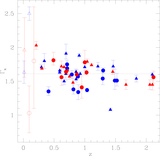
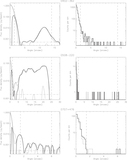
Caption: Figure 13.
Distribution of αrx for our sample, split into subsets by two different criteria. Upper limits are handled using the Kaplan–Meier method. Top: the sample is divided by redshift (excluding one with an unknown redshift). The high z subsample has marginally smaller values of αrx; i.e., the jets’ X-ray flux densities are slightly larger relative to their radio flux densities than for the low z sample. Bottom: the sample is divided according to the A or B category (see Section 2). The B subset shows slightly smaller values of αrx than the A subset, but we cannot rule out that the A and B targets were detected at the same rate at the 90% confidence level.
Other Images in This Article

Show More
Copyright and Terms & Conditions
© 2018. The American Astronomical Society.