Image Details

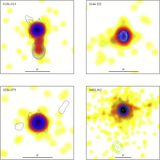
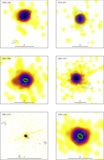
Caption: Figure 1.
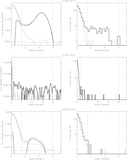
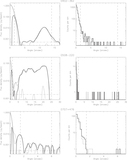
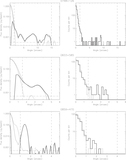
X-ray images from Chandra observations, with contours from Australia Telescope Compact Array or Very Large Array (VLA) images. The radio surface brightness contours increase by a factor of 2 and start at 5 times the rms noise, as given in Table 2. The X-ray images were convolved with 1″ Gaussians and then binned at 0.″0492, a tenth of a Chandra pixel. The color scale for all images is logarithmic, from 0.5 counts/beam (yellow) to 2500 counts/beam (black). See the text for comments on individual objects. A readout streak is apparent in the X-ray map of 2201+315.
Other Images in This Article

Show More
Copyright and Terms & Conditions
© 2018. The American Astronomical Society.
Copyright ©
2025 Astronomy Image Explorer. All Rights Reserved.