Image Details
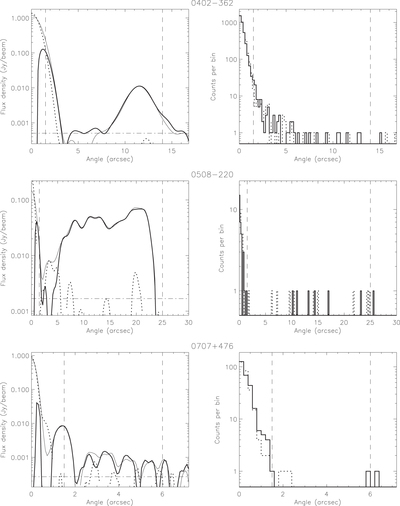
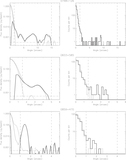
Caption: Figure 5.
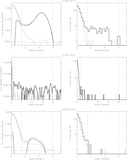
Profiles of the radio emission (left) and X-ray counts from Chandra (right) along the jet. The position angles of the jets are defined in Table 4. The vertical dashed lines demarcate the jet regions. The dotted lines in the radio panels give the profiles at a position angle 90° clockwise from the jet to avoid counter-jets. The bold, solid lines (left) give the differences between the profiles along the jet and perpendicular to it, nulling the core effectively. The horizontal dashed–dotted lines (left) are set to the average noise levels in each radio map. Because there are no clearly detected counter-jets in the X-ray images, dotted lines (right) give the profiles at a position angle 180° clockwise from the jet.
Other Images in This Article

Show More
Copyright and Terms & Conditions
© 2018. The American Astronomical Society.