Image Details
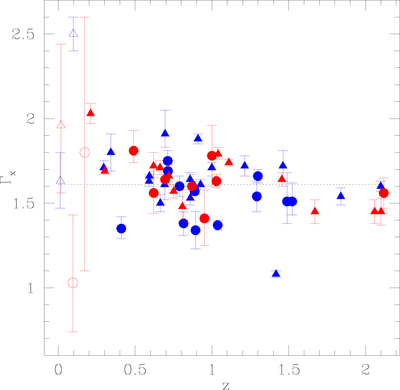
Caption: Figure 2.
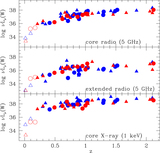
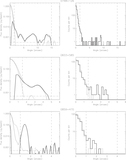
X-ray spectral indices of the cores plotted against redshift. Objects with X-ray jet emission (this paper) are shown as triangles, and those without such emission are plotted as circles. The unfilled symbols mark the five objects at z < 0.2 that are excluded from the calculation of the central value of the distribution (dotted line). The 32 sources that appear as γ-ray detections in the Fermi LAT 3LAC catalog (Ackermann et al. 2015) are shown in blue; the other 24 are in red.
Other Images in This Article

Show More
Copyright and Terms & Conditions
© 2018. The American Astronomical Society.
Copyright ©
2025 Astronomy Image Explorer. All Rights Reserved.